Responses
Specification Limits
Using the options under Specification Limits, the user can specify the optimization specifications for each response variable that is being considered. As an example, consider the following image.
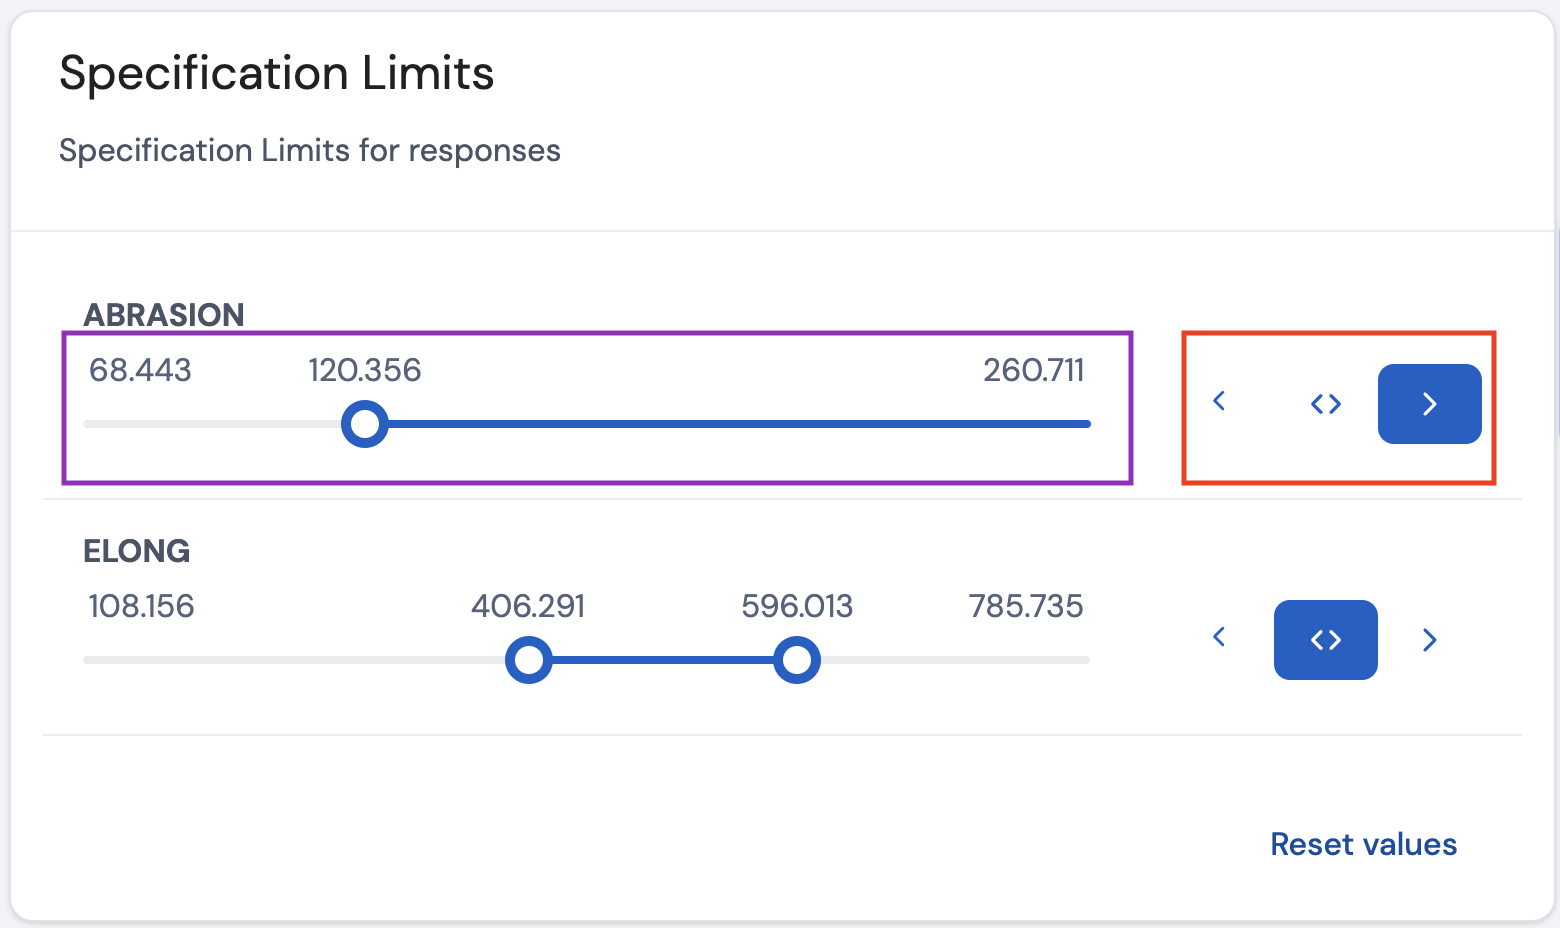
In this example, there are two response variables of interest: Abrasion and Elong. For the response variable Abrasion, the objective is to maximize the value with a lower limit of 120, and for the response variable Elong, the objective is to maintain its value between the range 400 to 600. A reference to the original data set can be found here.
To specify these objectives in the software, first select one of the three choices highlighted in the red box. The description of these choices are as follows:
- ‘>’ - Maximize the value for the response variable
- ‘< >’ - Maintain the value for the response varibale between a certain range
- ‘<’ - Minimize the value for the response variable
After selecting the objective, the user can then set the limits on the slider (highlighted in the purple box in the image above). Setting the limits depends on which one of the three choices was selected.
- ‘>’ - In this case, the user should specify a lower limit. In the image above, for the response variable Abrasion, we specified a lower limit of roughly 120, as we are interested in finding the settings for the input variables that predict a mean value equal to or above 120 for the response variable ‘Abrasion’.
- ‘< >’ - In this case, the user should specify a range of values. In the image above, for the response variable Elong, we specify both a lower limit and an upper limit of approximately 400 and 600, as we are interested in finding the settings for the input variables that predict a value between these values for the response variable Elong.
- ‘<’ - This is the opposite case of ‘>’. In this case, the user should specify an upper limit.
Interval Type
For each prediction value that is calculated for different combinations of settings of the input factors, a statistical interval is also calculated that quantifies the uncertainty around this predicted value. In the software, there are three choices as presented below.
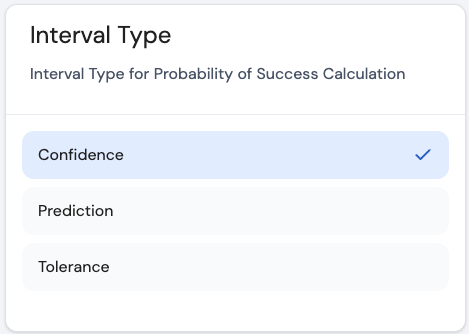
Using the options under Interval Type, the user can specify the type of interval that is of interest. Taking into account the selected models for each response, $\mathbf{X}$ to be the model matrix, $\widehat{\sigma}$ to be the estimate for the root mean squared error, $f(\mathbf{x})$ to the model expansion column vector of $\mathbf{x}$, where $\mathbf{x}$ is a vector with a specific combination of settings for the input factors denoted as $\mathbf{x}$, the different types of intervals are calculated as follows
- Confidence interval:
$$\widehat{y} ± t_{1-\frac{\alpha}{2}, n-p} \cdot \widehat{\sigma} \cdot \sqrt{f'(\mathbf{x}){(\mathbf{X’X})}^{-1}f(\mathbf{x})}$$
- Prediction interval:
$$\widehat{y} ± t_{1-\frac{\alpha}{2}, n-p} \cdot \widehat{\sigma} \cdot \sqrt{1+f'(\mathbf{x}){(\mathbf{X’X})}^{-1}f(\mathbf{x})}$$
- Tolerance interval:
$$\widehat{y} ± z_{\frac{(1+\psi)}{2}} \cdot \widehat{\sigma} \cdot\sqrt{1+f'(\mathbf{x}){(\mathbf{X’X})}^{-1}f(\mathbf{x})} \cdot \sqrt{\frac{n-p}{\chi^{2}_{\alpha,n-p}}}$$
Here, $\psi$ is the proportion of all future predictions that will be covered in the tolerance interval with a confidence of $100(1-\alpha)$%. By default, for all types intervals, $\alpha$ is set to 0.05, so that all intervals have a confidence level of 95%. For the tolerance interval, $\psi$ is set to 0.95 so that the tolerance interval covers 95% of all future observations with a confidence of 95%.
Selecting the type of interval that is of interest, will display such interval in the Profilers tab. The type of interval selected will also influence the calculations for the probability of success (which is presented in the tab Parallel Coordinates Plot).
Page last modified on 2 March 2025