Parallel Coordinates Plot
Optimization Graph
The optimization graph is a parallel coordinate plot, similar to the one available in the software for design and model selection. Based on the selected model for each of the response variables, this plot allows the user to visualize the predicted values for the average for each of the response variables for the many combinations of the settings of the input factors. The first few axes allow the user to set limits for the settings of the input factors, followed by axes for the response variables, and finally an axis for the probability of success values. Here is an example of such a plot.
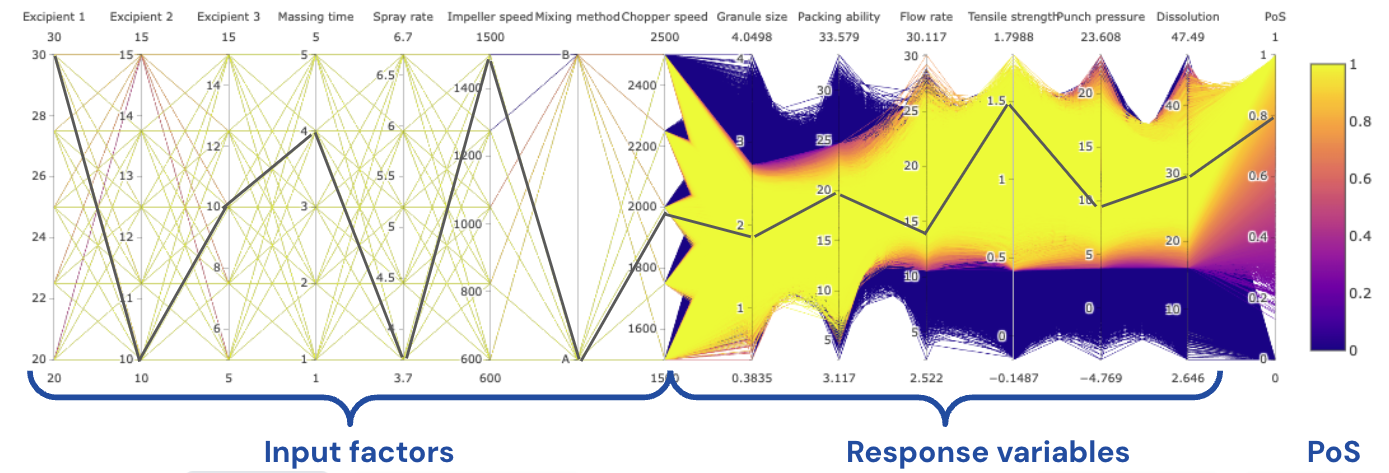
In the above example, the first 8 axes correspond to the input factors, the next 6 axes correspond to the response variables, and the last axis gives the values for the probability of success.
For a given combination of the settings of the input factors (highlighted in the image above using a black line), the probability of success (PoS) quantifies the probability with which the desired optimization goals (specified in the Responses tab) can be achieved for all response variables.
To be precise in our defintion, when
- the confidence interval option is selected in the Responses tab, the probability of success (PoS) quantifies the probability with which the desired optimization goals specified (in the Responses tab) can be achieved for the predicted value for the average for all response variables.
- the prediction interval option is selected in the Responses tab, the probability of success (PoS) quantifies the probability with which the desired optimization goals specified (in the Responses tab) can be achieved for the predicted value for one single future observation for all response variables.
- the tolerance interval option is selected in the Responses tab, the probability of success (PoS) quantifies the probability with which the desired optimization goals specified (in the Responses tab) can be achieved for the predicted value for 95% of all future observations for all response variables.
The PoS values for the average is always going to be greater than the PoS values for one single future observation, which in turn is always going to be greater than the PoS values for 95% of all future observations.
To learn how to interact and filter with this graph, see [1] and [2].
The discretization of the levels for each input factor can be controlled using the Discretization level option. For the finest grid of combinations of the settings of the inputs factors, choose the maximum discretization level value which is 11. In the example above, the discretization level is set to 5.
Note that the discretization level option takes into account any filters placed in the input factor axes in the parallel coordinate plot. On specifying a filter on one or more axes corresponding to the input factors, click on the Zoom button to discretize the levels of the input factor over the filtered range.
Technical note on the calculations for the probability of success (PoS) (click to unfold)
For a given response variable, the probability of success (PoS) calculation for its corresponding combination of the settings of the input factors is calculated as follows:
- If the value for the said response variable is to be maximized beyond a minimum value as entered in the Responses tab, the PoS value is the area under the probability curve for the distribution concerning the specific type of interval (specified in the Responses tab) that lies above the minimum value specified for the response.
- If the value for the said response variable is to be minimized beyond a maximum value as entered in the Responses tab, the PoS value is the area under the probability curve for the distribution concerning the specific type of interval (specified in the Responses tab) that lies below the maximum value specified for the response.
- If the value for the said response variable is to be maintained between a range with a specified minimum and maximum value as entered in the Responses tab, the PoS value is the area under the probability curve for the distribution concerning the specific type of interval (specified in the Responses tab) that lies between the minimum and maximum value for the response.
In the Responses tab,
- when the confidence interval option is selected, for the PoS, the probability curve of the distribution for the mean of the predictions for the given combination of settings of the input factors is considered.
- when the prediction interval option is selected, for the PoS, the probability curve of the distribution for a single future observation for the given combination of settings of the input factors is considered.
- when the tolerance interval option is selected, for the PoS, the probability curve of the distribution for 95% of all future observations for the given combination of settings of the input factors is considered.
When there are multiple response variables, a PoS value is calculated for each response, and a combined product is reported as the final PoS value.
Note: For combinations of the settings of the input factors for which the predicted value for the average for any one of the response variables is outside the specified ranges provided in the Responses tab, the calculated PoS value is reported as 0.
Selected Points
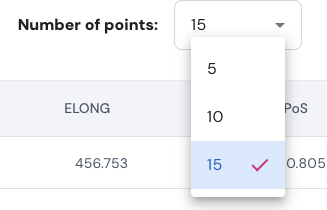
The Selected Points table lists 5, 10 or 15 best combinations of the input factors that have the largest value for the PoS. You can specify the number of points to be displayed using the following option
If any filters are placed by the user in the parallel coordinate plot, then this table will only show points that match the specified filtering criteria. Here is an example.
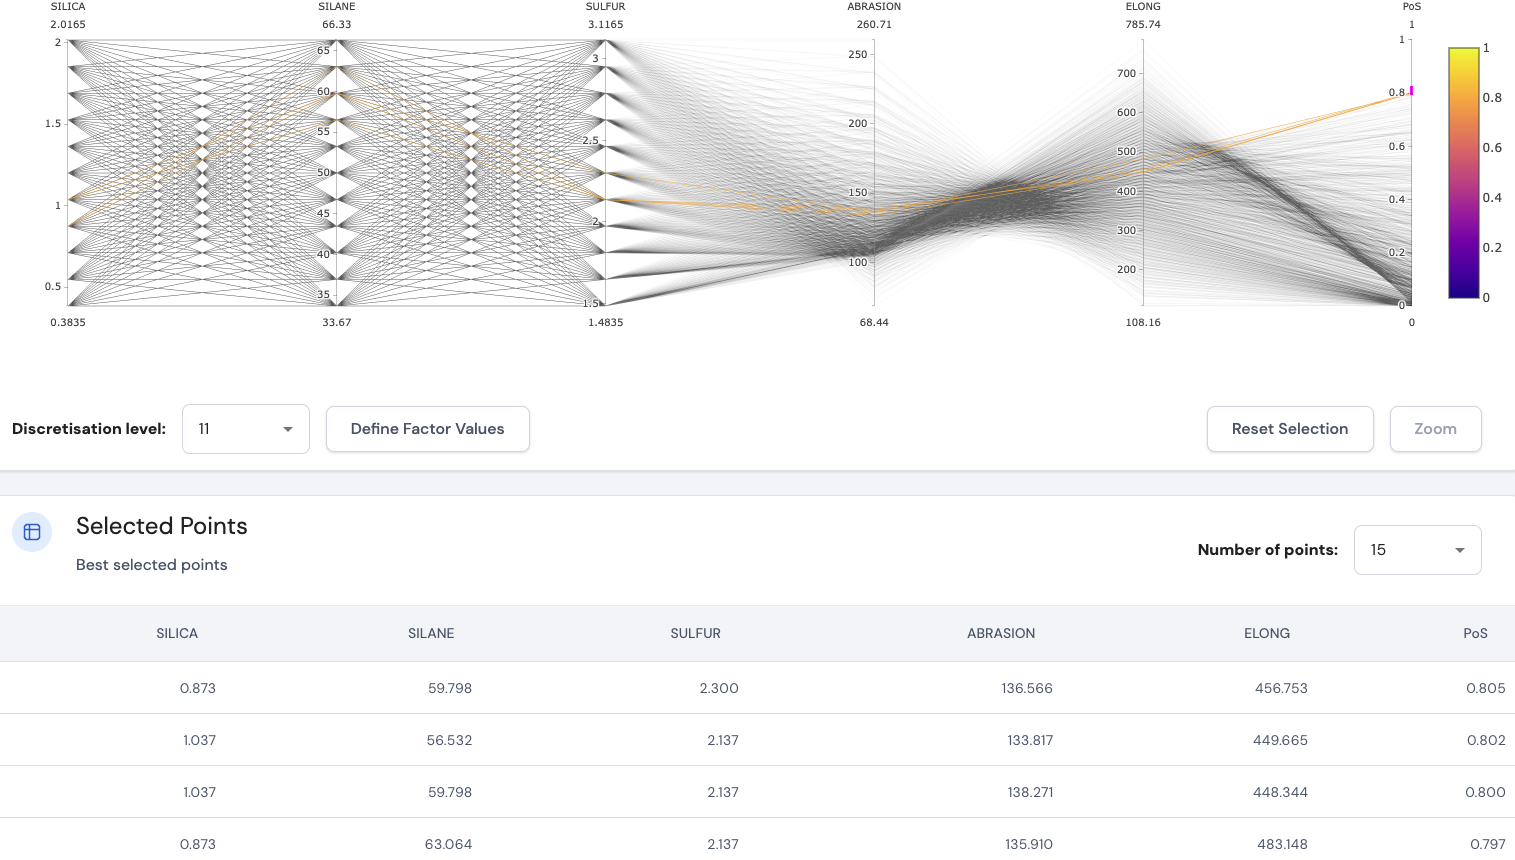
In the above example, a filter is specified for the axis with PoS values so that we get only the points or combinations of the the settings of the input factors that achieve a PoS value of 0.797 or higher. In this case, there are only 4 points that satisfy this constraint, and these are displayed in the Selected Points table, with all points being ranked by its PoS value.
Page last modified on 15 May 2025