Design size, powers and aliasing
Run size
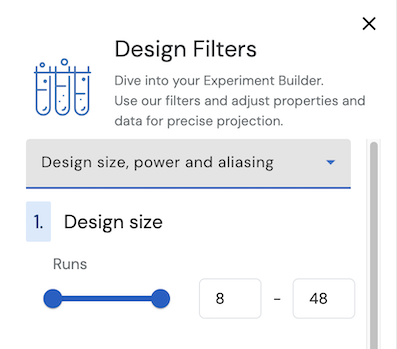
Use the following slider to set a range for minimum and maximum run size for your design of interest. A good advice is to add a couple of runs above and below your target run size to explore the full potential of our database
Power
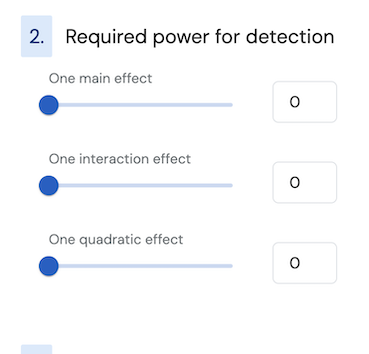
- Use the following slider to specify the minimum power to detect one main effect, one interaction effect or one quadratic effect.
- The base model contains the intercept and all main effects.
- The powers are calculated using a signal-to-noise ratio (SNR) of 1 and a significance level $\alpha=0.05$.
- It is possible to check the powers for different SNR values and thresholds of significance at a later stage for the final chosen design.
Technical considerations (click to unfold)
The power to detect an effect is primarily influenced by three things; the signal-to-noise ratio, reliability of the sample size and significance threshold. We will explain all three in this text.
The null hypothesis ($H_o$) is that a certain effect $\beta_i = 0$ and that the following term
$F_o = \frac{\beta_{i}^{2}}{\hat{\sigma}^2\mathbf{(X’X)^{-1}_{ii}}}$
follows a central F-distribution with $1$ and $n-p$ degrees of freedom where $n$ is the number of runs and $p$ is the number of parameters in the model matrix $\mathbf{X}$ including the intercept. In the expression, $\hat{\sigma}^2$ is the estimate of the mean square error from the model and $\hat{\beta}_i$ is the estimate of the size of an effect $i$.
Since we are calculating power for an active effect ($\beta_i \neq 0$), in this case, the true $F$ has a non-central F-distribution, where the non-centrality parameter is calculated as follows:
$\lambda = \frac{(\beta_{i}^{*})^{2}}{\sigma^{2}\mathbf{({X}‘X)^{-1} _{ii}}} = \frac{(SNR)^{2}}{\mathbf{({X}‘X)^{-1} _{ii}}}$ .
Here, $\beta_{i}^{*}$ is the true size of the effect i and $\sigma^2$ is the true value of the standard error. The ratio of the true effect size and true standard error is often referred to as signal-to noise ratio (SNR). For design characterization, the default value for SNR is set to 1.
Next, a significance threshold ($\alpha$) needs to be set. This is the p-value at which a significance conclusion will be drawn. For design characterization, $\alpha$ is set at 0.05.
Summarized steps to calculate power for each effect:
-
The preset value of SNR (=1) and $\mathbf{(X’X)^{-1}_{ii}}$ is used to calculate the non-centrality parameter $\lambda$.
-
Calculate ‘Critical F-value’ from a central distribution F-table with $\alpha=0.05$, with $1$ and $n - p$ degrees of freedom.
-
Obtain the type II error using non central F-distribution(Critical F-value, $1$ , $n - p$, $\lambda)$. The type II error is the probability of accepting the null hypothesis, when the alternative hypothesis is true. The type II error is denoted as $\beta$ (not to be mistaken with the effect size in a statistical model).
$\textit{Power} = 1 - \beta$
Note: When random block effects are included, the term $\mathbf{(X’V^{-1}X)^{-1}_{ii}}$ is used in step 1.
To determine the power for:
- Single main effect: the model matrix $\mathbf{X}$ consists of the intercept and all the main effects columns. The minimum power attained for any of the main effect is recorded.
- Single interaction effect: the model matrix consists of the intercept and all main effects columns and the one interaction effect column. For all designs, all individual interaction effects are tested separately in a base model that includes all main effects and the minimum power attained for any of the interaction effect is recorded. The user can use the slider to set the minimum power requirements to detect a single interaction effect in a base model with all main effects.
- Single quadratic effect: the model matrix consists of the intercept and all main effects columns and the one quadratic effect column. For all designs, all individual quadratic effects are tested separately in a base model that includes all main effects and the minimum power attained for any of the quadratic effect is recorded. The user can use the slider to set the minimum power requirements to detect a single quadratic effect in a base model with all main effects.
When fixed block effects are considered, the model matrix will also include dummy coded block effect columns.
-
Aliasing
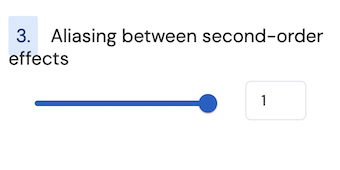
Use the following slider to fix the maximum absolute value of the aliasing/correlation between any two second-order effect. The slider ranges from 0 to 1.