Overview: boxplots
The distribution of relevant characteristics of the designs is displayed using boxplots.
The boxplot view
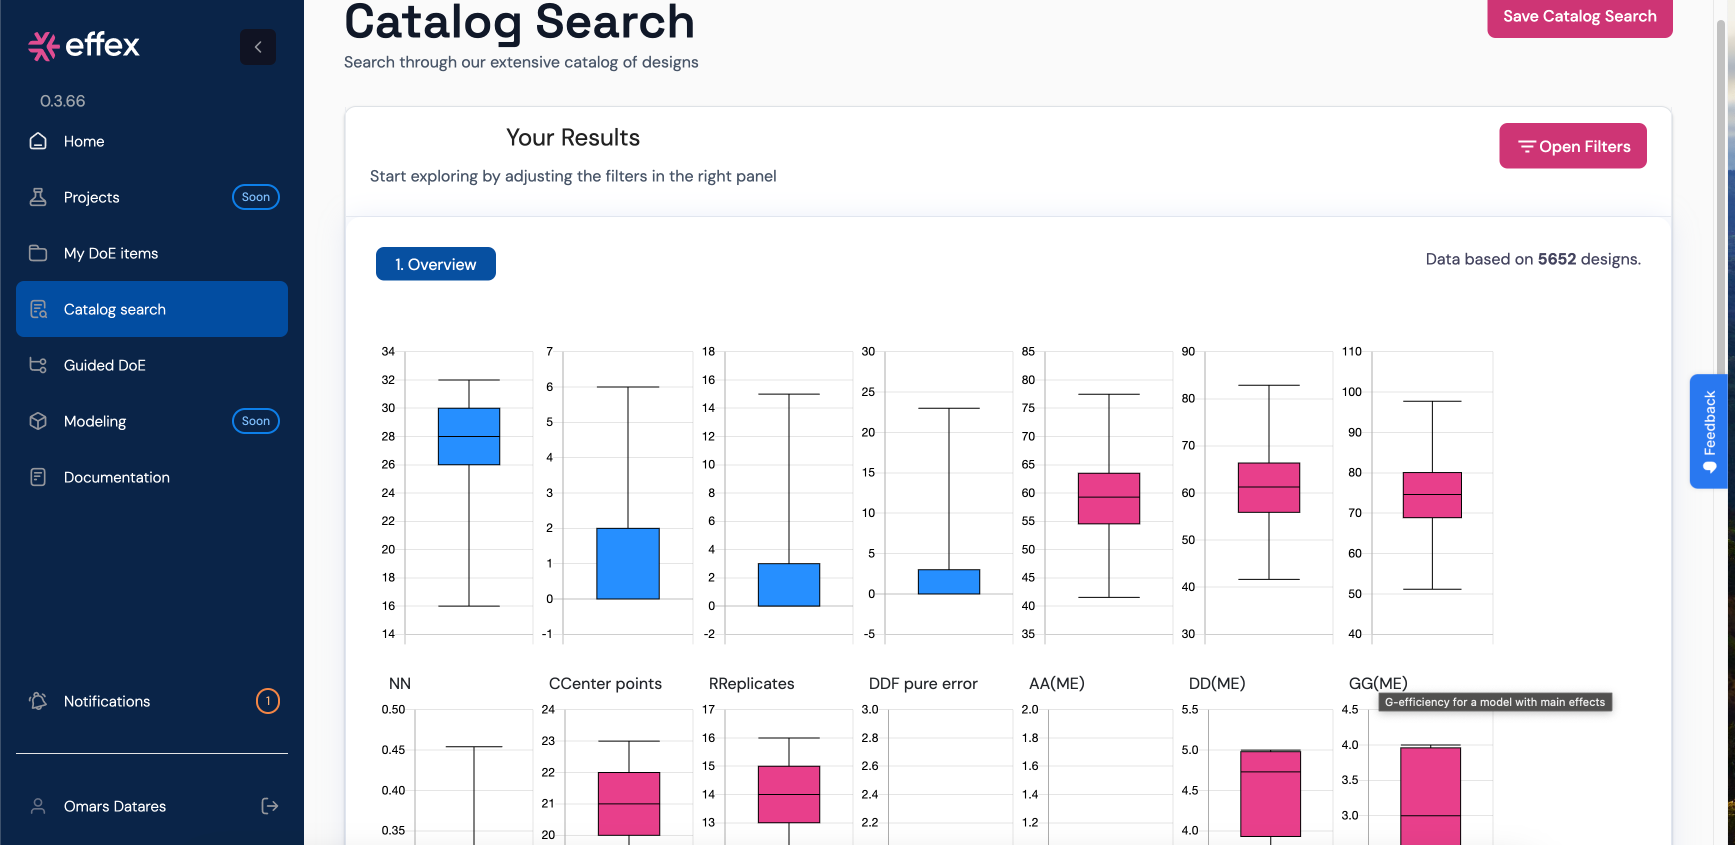
Boxplots are a very useful way of visualizing the characteristics of a large number of designs. In the image above you can see that the filtering controls output consisted of $5,514$ designs. Each boxplot corresponds to one characterization criterion of the design, and it represents the distribution of such criterion on the selected designs. To see a list of the characterization criteria, go to glossary
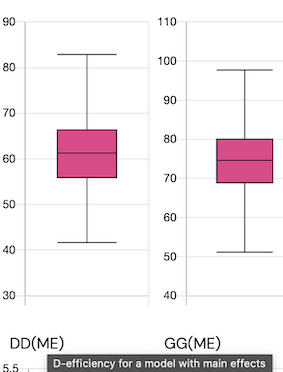
In the figure left to this text you can see a boxplot for the D-efficiency for a main effects (ME) model, denoted as $D(ME)$, for the $5,514$ designs selected. We can observe that the median has a value around $70$, and the minimum lies below $50$ and the maximum over $90$.
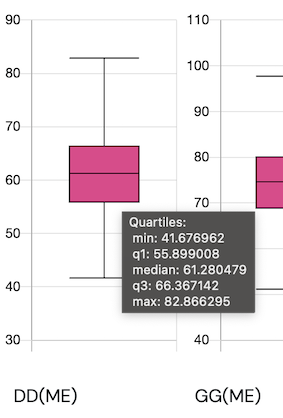
If you want to see the exact values for the minimum, the $25\%$ quantile, the median, the $75\%$ quantile and the maximum, you just need to place your mouse on the boxplot and a tooltip will appear.
Page last modified on 3 March 2025